Turning Process Data into Action
Reveal bottlenecks, reduce variants, and improve compliance
Unlock the goldmine in your own data
Current challenges:
Search inefficiency
Skilled workers spend 19% of their time at work searching for and gathering externally available information
Bad data cost
An estimated $3.1 trillion per year is spent in the U.S due to poor data quality and the lack of meaningful insights
Insight-driven growth
Companies that adopt data-driven decision-making show 5–6% higher output and productivity on average
From process guesswork to data-driven improvement
Scheer PAS process mining and analysis creates a fact-based overview of how your processes actually run across SAP and surrounding systems. Instead of relying on workshops and static documentation, you get evidence from event data: real process paths, true cycle times, and deviations from the standard. Those insights then feed targeted improvement and automation.
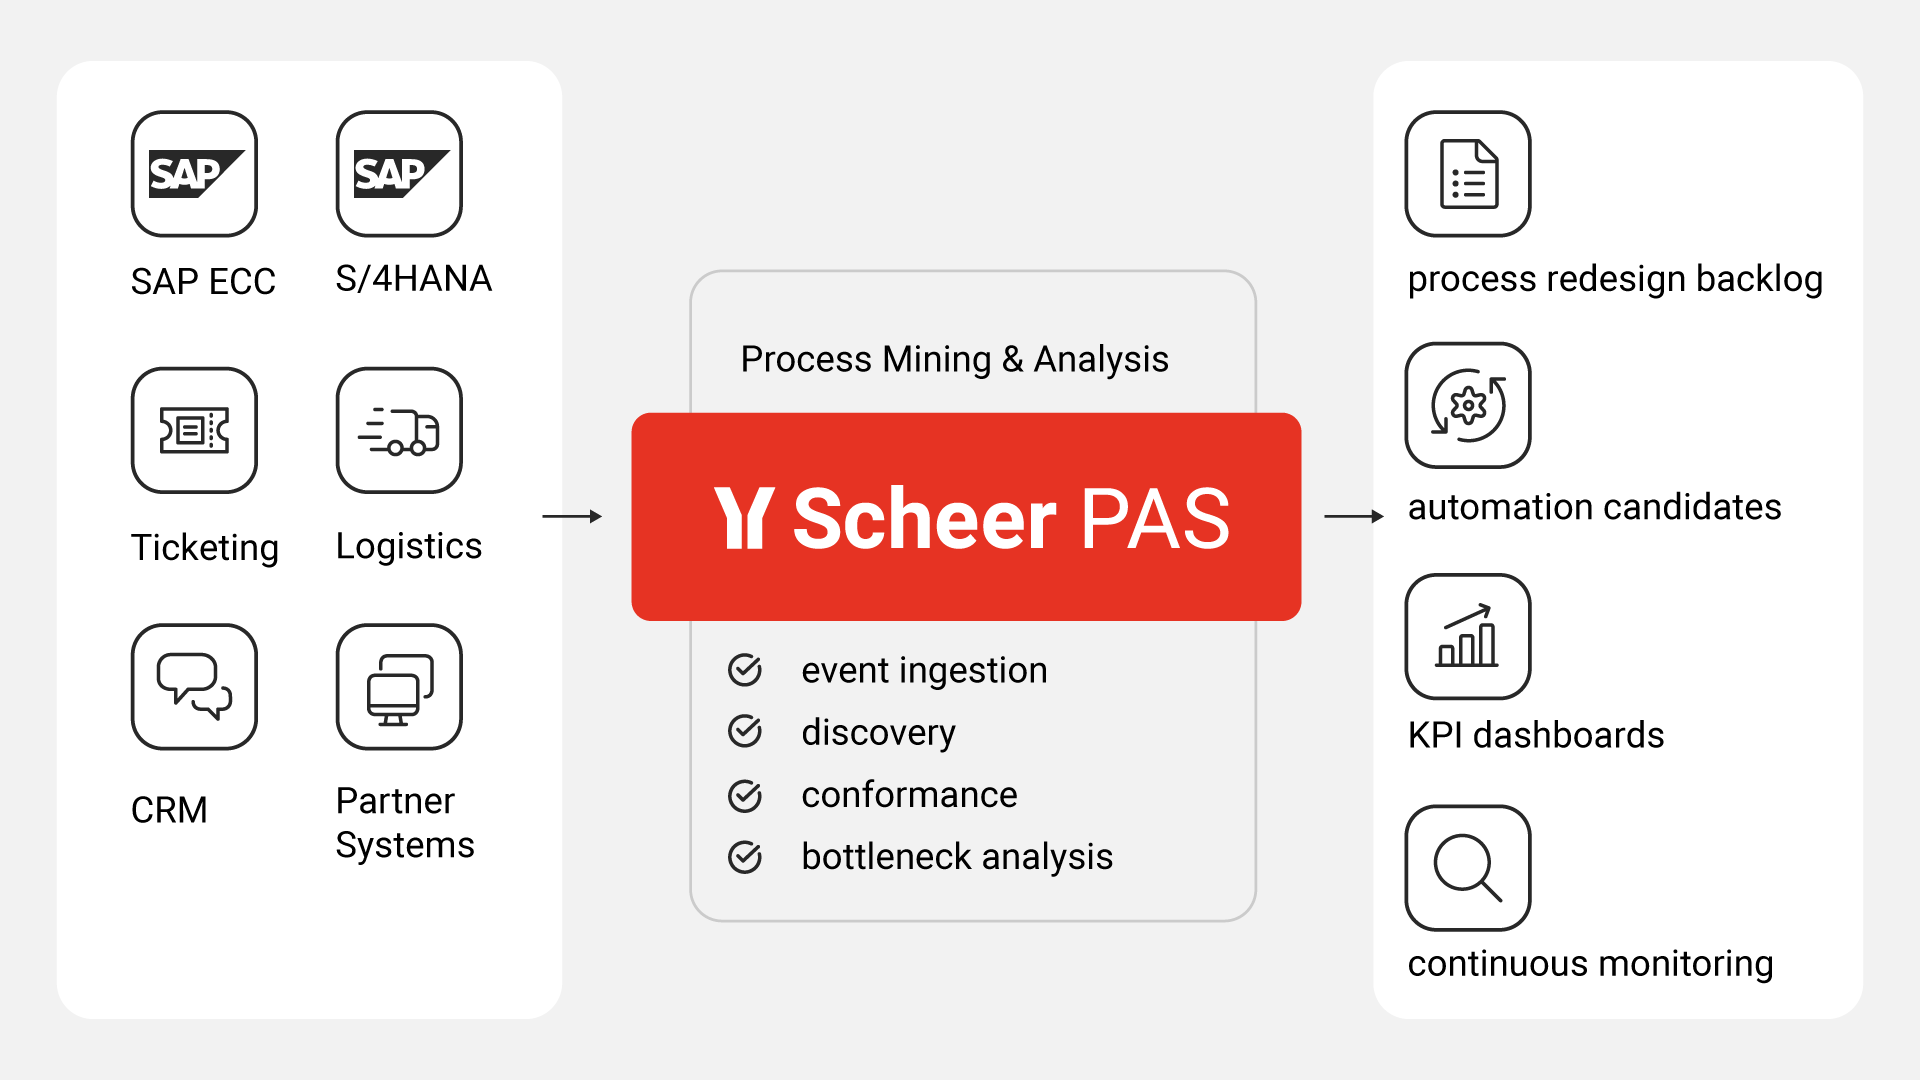
Scheer PAS can ingest process-relevant event data from SAP (both ECC and S/4HANA) and non-SAP applications such as CRM, ticketing, WMS, partner portals, and custom systems. The objective is a single analytical view of the end-to-end process, not isolated system reports.
Using event logs, the platform reconstructs the process as it is executed in reality, showing the dominant paths and the long tail of variants. This replaces “best-guess” documentation with an objective process model that stakeholders can quickly align on.
Scheer PAS highlights where time and cost accumulate: repeated handovers, approvals that loop, rework after error corrections, and process segments that consistently exceed SLAs. Analysis then goes beyond a single average cycle time by separating standard cases from exception patterns.
Compare execution against a target process (policy, standard operating procedure, or governance model). Deviations become measurable: where steps are skipped, performed out of order, or executed without required controls. This supports audit readiness and operational risk reduction.
Insights are translated into action: which process variants to standardise, which decision points to redesign, and which tasks are stable enough to automate. For many organisations, process mining becomes the “prioritisation engine” for process automation. Therefore, the automation starts with the highest-value, lowest-regret opportunities.
Measurable benefits and outcomes
Key metric |
Improvement |
Impact |
|---|---|---|
Process transparency | One source of truth for actual execution and variants across systems | Faster alignment between business and IT; fewer “opinion-based” workshops |
Cycle time | Bottlenecks and rework loops become visible and actionable | 10–30% reduction in cycle time in prioritised processes (typical project target range; validate via baseline) |
Operational effort | Effort shifts from manual data collection to decision-making and execution | Shorter analysis phases; higher improvement throughput per quarter |
Compliance and audit readiness | Deviations and control breaks are identified continuously rather than late | Reduced audit preparation effort; fewer compliance surprises |
Automation ROI | Automation candidates are selected based on frequency, stability, and value | Higher success rate for automation programs; fewer automations built on edge cases |
Deploying process mining and analysis safely
Scheer PAS is typically introduced in a phased, non-disruptive approach. It builds on your existing systems and logs rather than replacing operational applications. Most organisations start with one high-impact process, prove value with baseline KPIs, and then expand the process mining scope across functions and regions.
Typical adoption approach
1
Process selection and KPI baseline
Pick a process with high volume, SLA pressure, or recurring compliance questions (for example Purchase-to-Pay, Order-to-Cash, Incident Management). Define baseline KPIs such as cycle time, rework rate, touchless rate, and exception frequency.
2
Data integration and event log readiness
Connect SAP and non-SAP sources and define event semantics (case ID, activities, timestamps, key attributes). Ensure data quality rules are explicit so results are trusted.
3
Discovery, conformance, and root-cause analysis
Generate the real execution model, identify dominant variants, and quantify bottlenecks and deviations. Align findings with process owners and compliance stakeholders.
4
Improve, automate, and monitor continuously
Turn insights into a prioritised change backlog: standardisation, policy adjustments, workflow redesign, and automation opportunities. Keep monitoring to verify that changes deliver measurable improvement and remain stable.
Timeframe, scalability, and governance
Initial results
Often within weeks for a first process, depending on data availability and event quality
Scalability
Extendable across processes, regions, and systems once the event data pattern is established
Governance
Clear ownership for KPI definitions, data mappings, and target process standards; auditable logic for conformance checks and reporting
"In the era of agentic automation, process mining is no longer just about analysis: it is the sensory system for our AI agents. To orchestrate autonomous processes with confidence, you need the real-time transparency and guardrails that only integrated process mining can provide."
Dr. Christian Linn, Head of Product Development at Scheer PAS


